 Aditya Mishra
The Mirage of Perfect Accuracy
If your model performs flawlessly on data it already knows, you have taught it to recite, not to reason.
You run a script, accuracy climbs towards 100 per cent, and your gut does a victory dance. Then you load the test set and the celebration evaporates. Welcome to overfitting.
Overfitting is said to be bad, but is it always bad? Keep that question in mind as we explore the idea.
What is Overfitting?
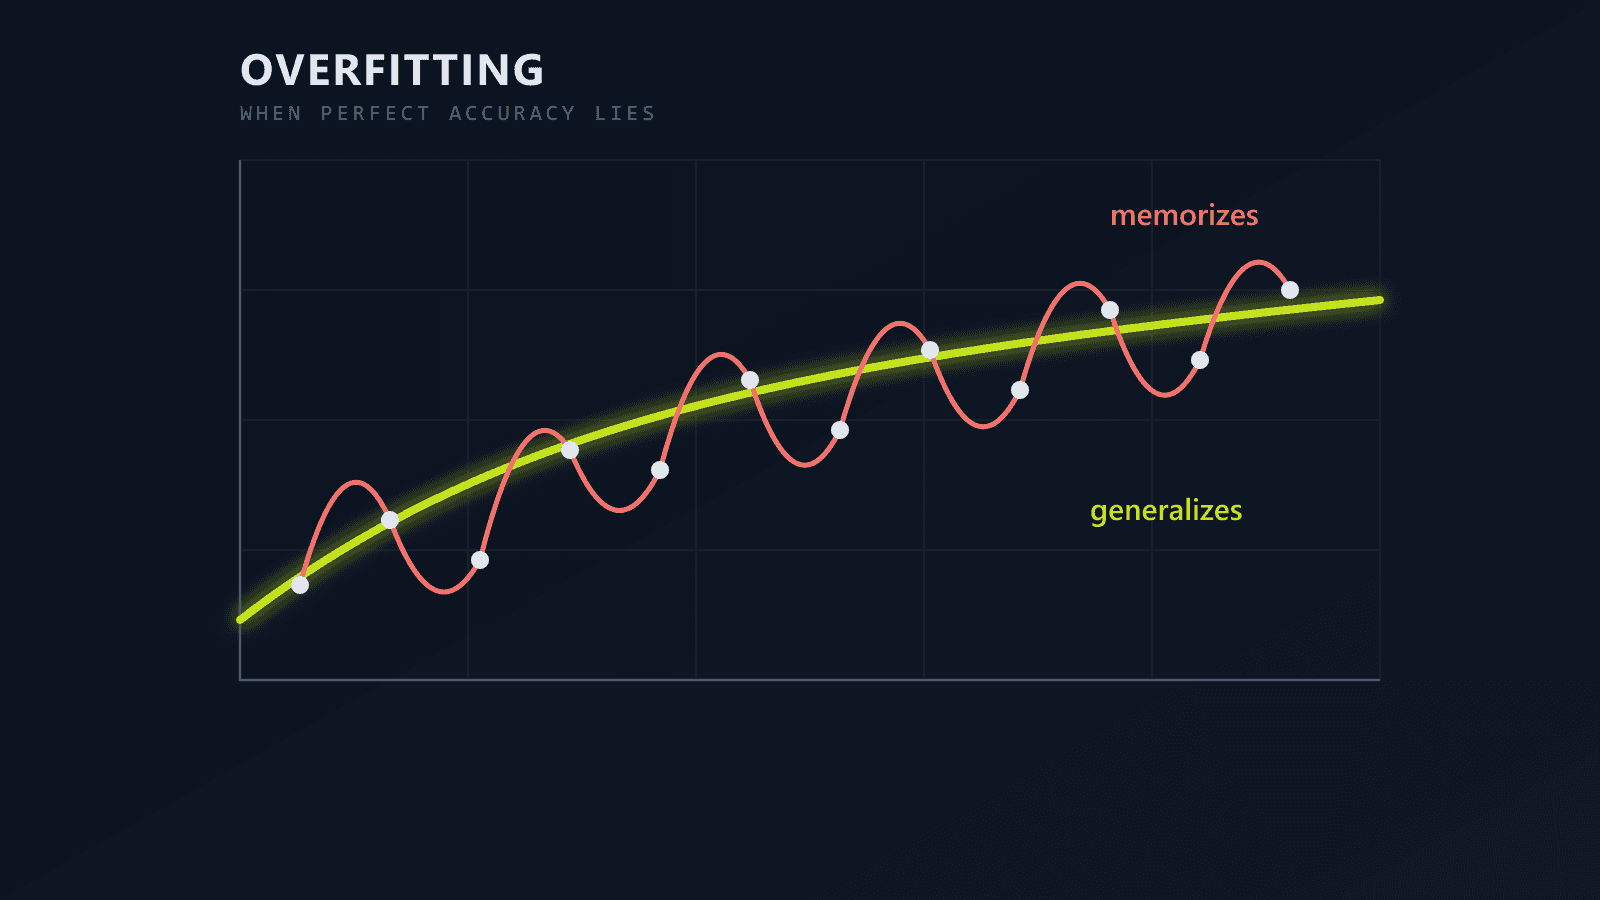
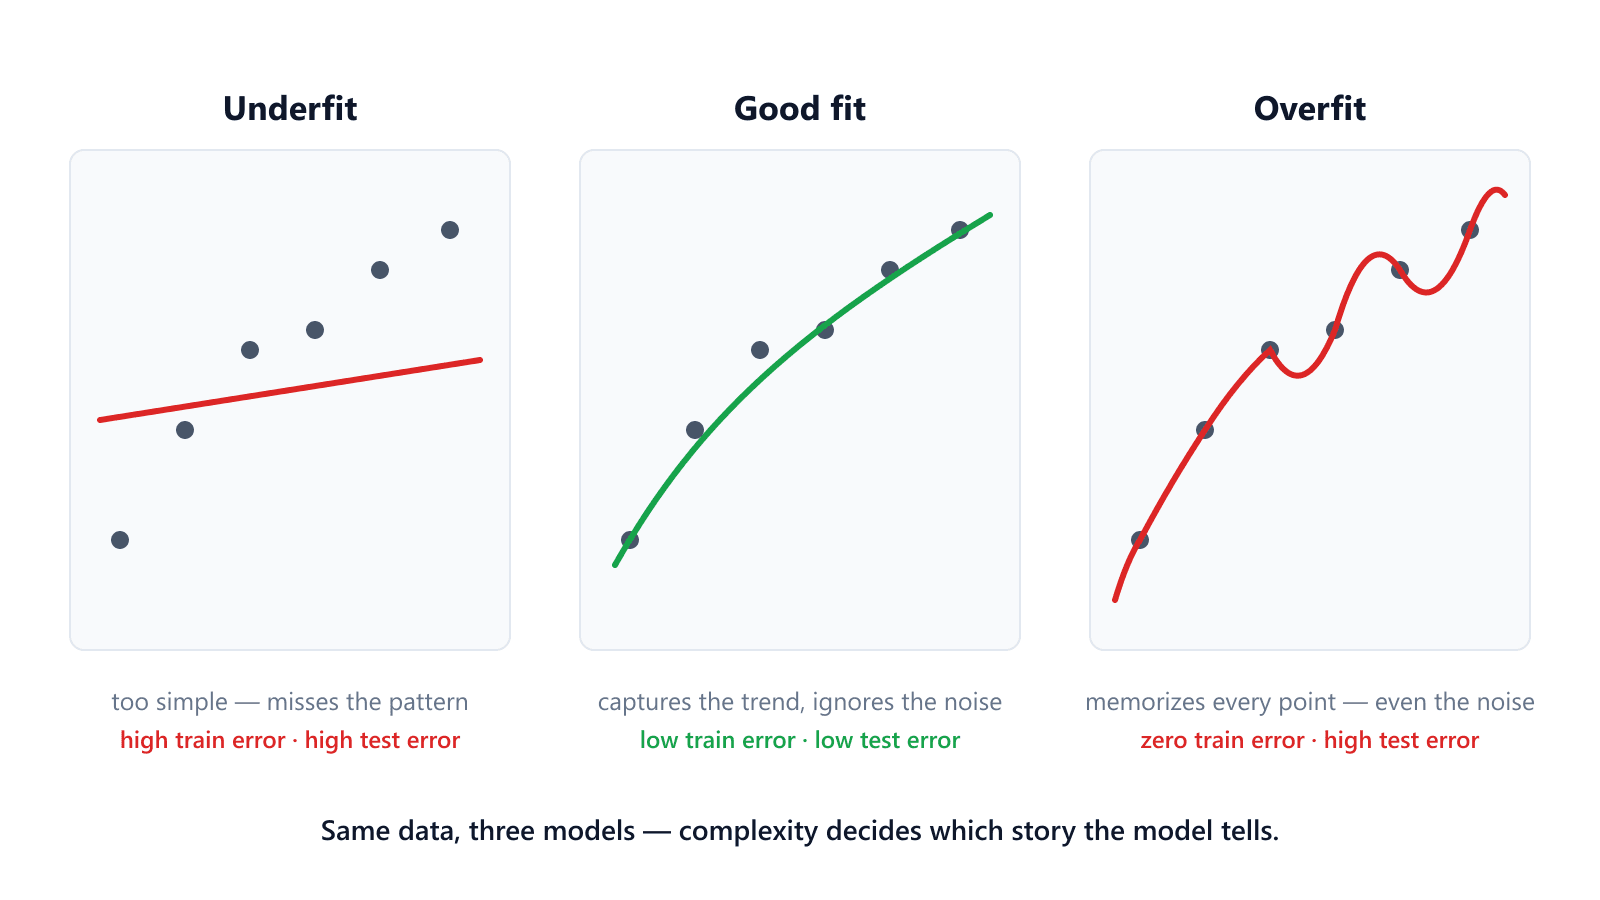
Overfitting occurs when a model memorises quirks of the training data instead of learning the underlying pattern. Think of revising only last year’s exam paper—you may ace a near-identical test but flounder on new questions.
Why Does It Happen?
- High model complexity—more parameters than the data can justify.
- Noisy or limited data—the model chases randomness.
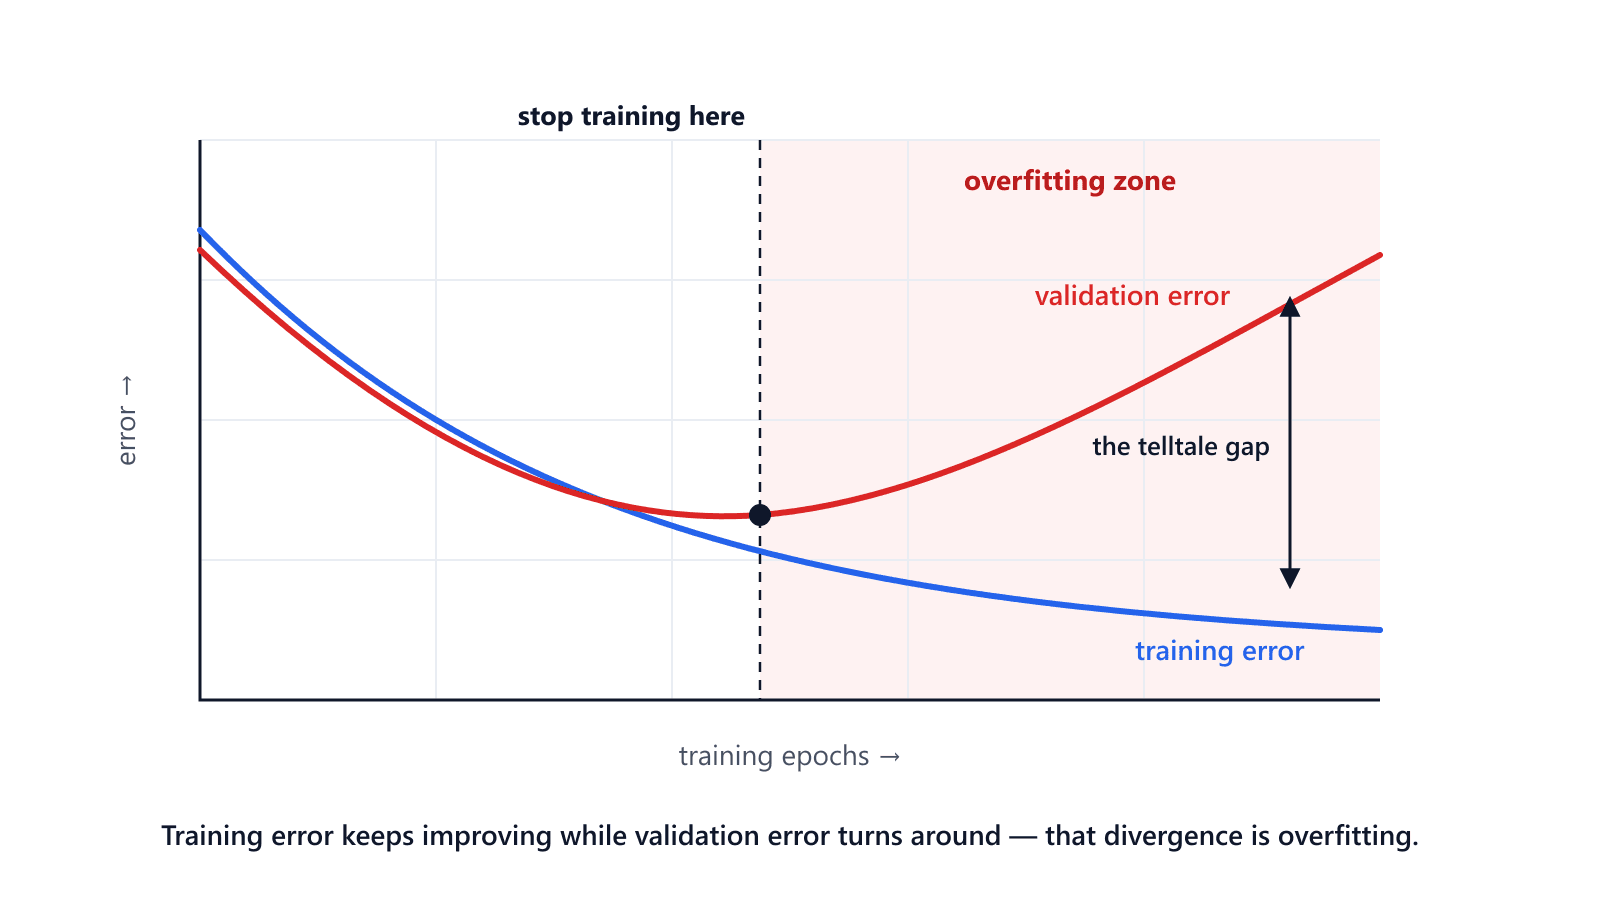
- Too many training epochs—it keeps tweaking until random error looks like signal.
How to Spot Overfitting
| Signal | Training Metric | Validation/Test Metric |
|---|---|---|
| Good fit | High, improving | High, improving |
| Underfitting | Low, stagnant | Low, stagnant |
| Overfitting | High, improving | Stalls or degrades |
Hands-On Classification Example
Run this snippet to watch overfitting unfold on a breast-cancer dataset.
import numpy as np
from sklearn.datasets import load_breast_cancer
from sklearn.tree import DecisionTreeClassifier
from sklearn.model_selection import train_test_split
from sklearn.metrics import accuracy_score

X, y = load_breast_cancer(return_X_y=True, as_frame=False)
X_train, X_test, y_train, y_test = train_test_split(
    X, y, test_size=0.3, random_state=42, stratify=y
)

shallow = DecisionTreeClassifier(max_depth=3, random_state=42)
deep = DecisionTreeClassifier(max_depth=None, random_state=42)

for model in (shallow, deep):
    model.fit(X_train, y_train)

def report(model, name):
    train_acc = accuracy_score(y_train, model.predict(X_train))
    test_acc = accuracy_score(y_test, model.predict(X_test))
    print(f"{name}: train {train_acc:.3f} | test {test_acc:.3f}")

report(shallow, "Shallow")
report(deep, "Deep")
You will notice the deep tree hits perfect training accuracy yet slips on unseen data—classic overfitting.
Visual Regression Experiment
This plot shows underfitting, a good fit, and overfitting when approximating a noisy sine curve.
import numpy as np
import matplotlib.pyplot as plt
from sklearn.preprocessing import PolynomialFeatures
from sklearn.linear_model import LinearRegression
from sklearn.pipeline import make_pipeline

rng = np.random.RandomState(1)
X = np.sort(rng.uniform(-3, 3, 40))[:, None]
y = np.sin(X).ravel() + rng.normal(scale=0.15, size=X.shape[0])

degrees = [1, 4, 12]
plt.scatter(X, y, s=20, label="Samples")

X_plot = np.linspace(-3, 3, 300)[:, None]
for d in degrees:
    model = make_pipeline(PolynomialFeatures(d), LinearRegression())
    model.fit(X, y)
    y_plot = model.predict(X_plot)
    plt.plot(X_plot, y_plot, label=f"degree {d}")

plt.legend()
plt.title("Underfitting vs good fit vs overfitting")
plt.show()
Degree 1 under-fits, degree 4 captures the curve well, and degree 12 wiggles frantically to kiss every point—overfitting in visual form.
Is Overfitting Always Bad?
Andrew Ng once noted that a low-bias, high-variance model can sometimes be tamed with more data faster than a high-bias, low-variance one can be improved.
Context matters. Mild overfitting can be acceptable in certain scenarios.
- Extremely large and fresh data streams where new examples arrive continuously.
- Risk-tolerant competitions or benchmarking where slight variance is acceptable.
- Highly personalised recommenders that intentionally bias towards one user’s history.
Strategies to Prevent or Mitigate Overfitting
- Use hold-out validation or k-fold cross-validation to monitor generalisation.
- Apply regularisation such as L1, L2, dropout, or early stopping.
- Prefer simpler models when they suffice—Occam’s razor often wins.
- Gather more data or use augmentation to turn variance into signal.
from xgboost import XGBClassifier
model = XGBClassifier(n_estimators=500)
model.fit(
    X_train, y_train,
    eval_set=[(X_test, y_test)],
    early_stopping_rounds=30,
    verbose=False
)
Real-World Illustration
In 2015 a diagnostic model for diabetic retinopathy achieved astounding accuracy on an internal dataset. Deployed in a rural clinic, its error rate spiked. Post-mortem analysis showed the model had fixated on camera metadata and lighting artefacts unique to the training hospital. What looked like genius was stage lighting.
Final Thoughts
Overfitting is neither monster nor myth. It is a signal—sometimes of model power, sometimes of data poverty. Treat it like a sharp knife: invaluable in skilled hands, harmful in careless ones. Next time your training metric skyrockets, ask yourself whether you have built a thinker or a parrot.